Here are ongoing observations by Mike, using reliable data sources, to offer a pragmatic summary of New Zealand’s economic situation. It’s also intended to combat some of the misleading commentary available.
Over the last 20 years, Mike has assisted large multinational corporations, high-growth export companies and New Zealand government agencies. Mike has had roles as a professional director, chartered accountant and Dean of Waikato University Management School.

March 15, 2021
In our last few newsletters we’ve been cautiously upbeat about New Zealand’s economic prospects, and somewhat critical of doom-casting by some economists and pundits. Those that relied on tracking underlying economic activity data and trends, as we tried to do, proved to be a lot more in tune than those that built models based on heroic assumptions about what could happen (for example Infometrics’ Brad Olsen and wildly overblown forecasts of unemployment).
But New Zealand’s overall economic results have been at the more positive end, even of our anticipated spectrum. So we thought we’d update our perspectives, and reinforce the value of taking into account underlying high frequency data.

To begin with, it’s worth noting that Standard & Poor’s on 22 February 2021 upgraded NZ’s sovereign international credit rating to AA+ stable (the same as the USA and ahead of the UK), citing “The country’s handling of the pandemic and strength of economic recovery”; the first economy to receive an upgrade since the pandemic began.
This means our sovereign risk remains very low, which will be reflected in lower interest rates, and the corollary is that this also helps explain our comparatively high foreign exchange rates (with the exception of compared to Aus which has also done well in managing COVID19).
So here’s a summary of some key activity data:
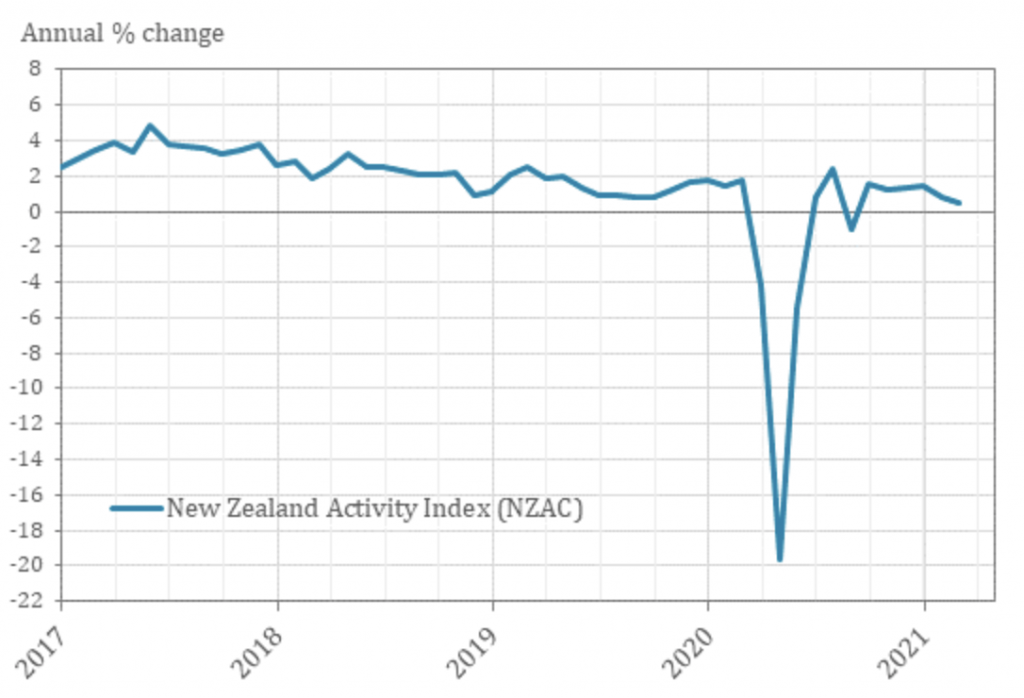
The New Zealand Activity Index (NZAC) indicates modest activity growth in February (+0.5% compared to February last year). This is remarkable given all that’s happened, and that the significant sectors of Tourism and Education are struggling with lack of international travellers.
Primary production remains a significant driver of the economy as does construction. Fonterra this week raised their 2020/21 forecast Farmgate Milk Price range by 40 cents to $7.30.
$7.90 per kg of Milk Solids as consistent strong demand, particularly from China, has driven up prices. This is the highest forecast payout since 2014.
Business ‘own activity’ confidence is at the highest since mid 2017 at +20. We tend to prefer the ‘own activity’ measure relative to the general business confidence measure, because the latter is more speculative, whereas ‘own activity’ relates to own intentions and action.

MBIE’s advertised jobs on line index is indicative of prospective employment. In January 21 it was at 151.7, the highest in a year and close to the 154.5 of a year ago.
Similarly, Stats NZ number of paid jobs as at 8 March based on IRD filings at 34 days (the most accurate period) was at 2,237,350, 14,000 ahead of the same time last year. There has also been a steady decline this year in the number of people on jobseeker benefit (eg down 2,600 on 5 March from 28 Feb.), but still 46,000 higher than the same time last year.
In the year to March 2020 pre-COVID, international tourists generated $17.5 billion, and international students generated $4.2 billion. Domestic tourism generated $24.4 billion, but NZ tourists also spent $7 billion travelling overseas. Refer some statistics here.

All of these markets were radically disrupted by COVID-19. Much of the international revenue was lost creating significant challenges for these industries, although this was ameliorated to some extent by substitution spending by New Zealanders on more domestic tourism. As at March 2020, 225,000 people were employed in tourism, and back in May job losses were predicted at in excess of 100,000. In the event they were very much lower (see https://www.careers.govt.nz/job-hunting/whats-happening-in-the-job-market/covid-19-and-the-labour-market/ for details), with education jobs actually increasing.
Given the decimation to these sectors it’s remarkable that employment overall has held up as well as it has. A key takeaway is that we can assume significant labour market pressure as these sectors open up again within the next few months and require increased labour, first to Australia and more widely probably by year end. Immigration is likely to be more tightly controlled over the next year or more to give our infrastructure a chance to catch up with the growing population.

Low wage imported labour, for example for the horticulture industry, is likely to be more restricted as the government seeks to move towards higher labour productivity; the intent will be to encourage greater technological innovation beyond relying on cheap imported labour. Moreover there are signals from government ministers, some tourism industry insiders and environmental advocates that the tourism industry was becoming unsustainable, and that going back to high volume mass tourism is not the way forward. What is, has not yet been articulated.
COVID-19 will continue to dominate the economy and society for a while yet.
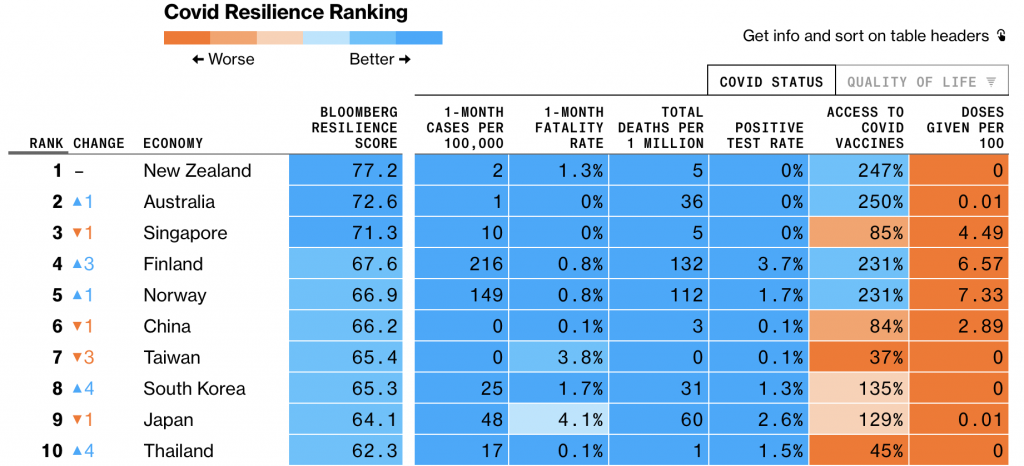
Bloomberg rated New Zealand top of 53 countries in respect of COVID 19 resilience on 25 February 2021, and on January 28 The Lowry Institute ranked New Zealand the best out of nearly 100 countries at responding to the COVID-19 outbreak. It’s beyond dispute that we’ve done exceptionally well relative to other countries in respect of health, social and economic strategies and outcomes. Collectively we can feel proud of what’s been achieved, and this will provide immense opportunities based on our enhanced reputation.
But with the vaccine roll-out we are entering the exit phase now, which will arguably be the most challenging.
The goal of the government is for a high proportion (ideally 90%+) of the population to be vaccinated by year end to achieve herd immunity through vaccination, thereby bringing an end to the pandemic in New Zealand and the potential for opening the borders. But with the disease so rampant around the world it will be a while if ever before it is eradicated. Regular perhaps annual booster shots will be needed.

Arguably the strategic choice of the gold standard Pfizer vaccine for everyone in NZ will prove as prescient and strategic as the elimination strategy that has kept us safe to date. The Pfizer vaccine achieved c. 95% efficacy in clinical trials and this has been reflected in similar levels of effectiveness from the large scale roll out in Israel. All the approved vaccines seem to offer high levels of protection against serious illness or death, but Pfizer seems to be the best at providing high levels of protection against symptomatic illness. This latter is the key to herd immunity because lack of symptoms reduces the risk of transmission. The other advantage of a Pfizer is that because it’s an mRNA or ‘messenger’ vaccine it can be reasonably quickly tweaked to deal with new variants as they emerge.
A high level of vaccine acceptance in the population, say 90%, combined with 95% efficacy would achieve the goal of herd immunity, whereby there would not be sufficient pathways for the virus to spread and outbreaks would die out. Those who cannot for health reasons get a vaccine and those who decline will for the most part be protected by the majority, and opening the borders can occur. But along with immense new opportunities, the opening-up phase will bring ethical, legal and practical questions for government and for business.
Key questions for business, for example, are:
- In order to keep your workplace safe, will you require new employers to have already been vaccinated?
- How will you manage existing employees who cannot or won’t accept a vaccination, if they are working in roles where they could come in contact with people who are vulnerable if exposed to COVID-19?
- Will your business require customers to have been vaccinated in order to provide them with certain services, such as air travel, gym membership or hospitality?
Our quick survey of the economic terrain would not be complete without some thoughts on interest rates and the housing market.

The New Zealand 10 Years Government Bond has a 1.738% yield at 14 March 2021, up from 0.444% just a few months back at 27 September 2020). The rate has increased substantially over the last few months on the back of an increase in medium term inflation expectations, arising from the substantial COVID-19 fiscal stimulus (local and global) and large scale monetary quantitative easing.
On the one hand monetary easing has created a reservoir of cheap money which businesses and home owners are taking advantage of. But this has in turn prompted dramatic asset price inflation in particularly housing and shares and the risk of CPI inflation in the medium term, which in time will lead to shorter term interest rate increases.
We think that interest rates will remain low for much of this year, and that the Reserve Bank will sustain its stimulus whilst inflation remains below its target of 2%, and may even allow an overshoot given inflation has been below target for so long. But all bets could be off once the economy opens up post COVID19 when there is potential for a tsunami of increased economic activity.

Lots has been written about the reasons for the dramatic house price inflation of the last year, against early predictions. But at its essence the root cause is simple; it comes down to mortgage affordability. Mortgage interest rates are so low now that despite the huge price increases housing affordability has actually improved, assuming of course that you can find the deposit.
But most bank economists seem to be expecting a reduction in the rate of increase in house prices this year perhaps down to single figures. And concern is starting to be heard about risks to affordability from potential interest rate hikes. So we expect to see over this year some combination of loan to value ratios, stricter affordability measures and minimum deposits being used by banks to reduce the exposure in the event of a house price correction.
We will be pleased to discuss any matters arising from our observations.

February 9, 2021
Treasury Forecasts announced today show a dramatic $60 billion reduction from the Sept 2020 forecast in the 2034 government Covid debt peak, down from an anticipated c. 50% to 36.5% of GDP. This is caused by NZs strong economic performance including a much better than expected GDP increase in the Sept qtr 14%, average earnings increase of 4.2% in year to Dec 2020, unemployment reduction from 5.3% to 4.9% in Dec 20 qtr.
At 36.5% debt to gdp NZ will be amongst the best in the developed world.
This puts us in a very strong position to make the well-being investments that are obviously necessary. After the Spanish Flu global pandemic 100 years ago there was a decade of prosperity and technological advancement remembered as the Roaring Twenties. History does tend to repeat, but with a twist. Could the 2020s be a new period of prosperity, and could the twist be that we start to prioritise well-being outcomes beyond measuring bald GDP economic outputs?
November 17, 2020
Six months ago I started posting regular economic updates based on high frequency economic data, because of doomcasting in the media that seemed to me to be ungrounded in available evidence. I was concerned that this could unnecessarily exacerbate anxiety at a time when the pandemic itself was bad enough.
We now know that:
- “Huge job losses when the wage subsidy comes off” (it has) did not materialise;
- “Unemployment rates in double digits” have not happened (Q2 4%, W3 5.3%);
- “10% drop in house prices because of job losses” – they are going dramatically up not down;
- “The worst recession in a 100 years” didn’t happen either – it was over by July.
The latest available 34 day filled jobs data from NZ Stats/IRD filings show 2,221,160 filled jobs at the latest available date of 4 October up nearly 60,000 on the same time last year. Job gains not losses.
MBIE’s jobs on line index of available jobs has risen steadily over the last three months to 138 (cf 39 in April 20 and 148 in Oct19). The number of people on Jobseeker / CIRP benefits as reported by MSD weekly continues to steadily decline even though the wage subsidy has finished.
The economy is proving remarkably resilient, so why did some economists and pundits get it so wrong? Whilst some of it may have been politicised, I believe there are seven main reasons which are relevant for the future also:
1. The best economic response did indeed prove to be the health response;
2. Many clients have told me that the wage subsidy worked for them as advertised – it gave them the confidence to hold onto employees which meant they could be quickly back operating as Lockdown receded and the economy improved;
3. The Covid shock has encouraged many to reimagine their operating models for the better to enhance resilience and respond to a post-Covid world;
4. Interest rates at an all time low have reduced the costs and risks of doing business (but at a price of rapidly escalating asset prices);
5. There was a tendency to make heroic assumptions (eg dramatic job losses when the wage subsidy finishes) or to pick up on anecdotes and extrapolate from there, rather than following the trend of underlying economic evidence;
6. The majority of our export trade is with China, Australia and Asia that have for the most part handled the pandemic well and have been less affected economically; and,
7. The ‘explore you own backyard’ mantra has definitely been effective.
I’m signing off from my updates now because it seems generally acknowledged that the economy is doing comparatively well. In doing so I make the following observations:
I regularly reviewed weekly economic updates by Treasury, Westpac, ANZ and Kiwibank and found their analysis for the most part useful. Westpac’s comparison to Australia using the same format was helpful, and they seemed to come closest with their forecasts. Infometrics was loud in the media and often wildly wrong.
NZ Stats has excellent high frequency economic data on weekly numbers of filled jobs and exports and imports, the MBIE monthly jobs on line index is a useful proactive guide to the job market, MSD weekly benefit dashboard shows movements in employment, and Treasury reports weekly high frequency economic indicators such as expenditure on credit cards.
November 17
From economic doomcasting, media and political commentary has shifted to the value of houses escalating much too rapidly. A lot of focus has been on the Reserve Bank’s quantitative easing and funding for lending programmes pushing too much cheap money into the economy, which is going into inflating asset values, notably houses and shares.
It’s a complex policy area which I will review in a subsequent post. But the current debate on the financial aspects of house inflation is missing one crucial dimension – demand and supply.
The estimated population of NZ increased by c. 104,000 from Q3 2019 to Q3 2020, much of this increase being returning New Zealanders. This is reflected in the >60,000 increase in people employed.
The larger population needs more housing. There were 37,725 new house building consents in the year to end Sept up 3.5% on the year before. But the average household size is about 2.6, so new consents don’t keep pace with population growth let alone contribute to the backlog.
October 19
Economic highlights this last week
1. ANZ in its weekly economic ‘data wrap’ updated its GDP forecasts for the Sept quarter to +10% and Dec quarter to +2.5%, recovering from the -12.2% in the June quarter.
2. The 8 October ANZ Business Outlook survey continued to show solid improvement across the board. Business confidence lifted 14 points to -15%, while own activity outlook lifted 9 points to +4%, up from -55% in April. Many activity indicators are now back in their 2019 ranges.
3. Treasury in it’s 16 Oct weekly update provides details of high frequency economic indicators, for example household spending remains strong with total electronic card spending up 3.2% annually to September.
4. Westpac in its weekly economic commentary observed that “The economy’s surprising resilience to Covid-19 continues”. They highlight our buoyant merchandise exports, which remain at similar levels to 2019, whilst noting the dependence on China and Asia which have recovered well from Covid in contrast to the USA and Europe. They note concerns for the global economy because of the economic consequences of failures to control the Covid pandemic.
5. On prospective employment MBIE shows the jobs on line index of available jobs for September at 133.4, up from 39 in April, close to the 136.6 score pre Covid in February, and only -9 from September 2019.
6. The latest available NZ Stats data on number of people employed based on IRD payroll filings at the most accurate level of 34 days after filing shows 6 Sept at 2207690 almost back to pre Covid levels – cf data at monthly intervals – 8 mar 2214920; 12 April 2145000; 10 May 2186420; 7 June 2209430; 12 July 2177990; 9 Aug 2199240.
7. The latest MSD weekly dashboard of 9 October shows that the number of unemployed people on either Jobseeker or CIRP continues to decline slowly (-600 over the prior week), at the same time as the number of jobs still supported by wage subsidy / leave payment continues to rapidly decline from c. 1.7 million at the height to 76,000 now. The large number of people coming off wage subsidy has not equated to higher numbers of unemployed, to the contrary in fact.
8. Of note from the Reserve Bank this week is that they sold over $1bn of three year bonds at a negative interest rate of -0.011%, and 13 year bonds at 0.687%. There are several implications of interest rates at these tiny levels so far into the future:
a. we don’t have to worry much about the affordability of government debt;
b. it calls in question the efficacy of traditional monetary policy to get inflation back to target growth levels;
c. the increase in money supply is inflating asset prices (eg share and houses) without impacting growth;
d. it’s a good time for businesses and the government to invest in value creating infrastructure.
All up, the incoming government faces a challenging, but relatively encouraging economic context.
September 16
Two high profile pieces of economic information this week. The GDP decline for the June quarter 2020 will be published tomorrow 17 Sept by NZ Stats.
Most economists are predicting it will be between -11.5% and -15%. This is a substantial improvement on the figure in the May 2020 Treasury budget forecast of up to -25%. Westpac in their 14 Sept weekly economic update (they for example came closest on the unemployment prediction for the June quarter) is predicting -11.5% GDP for NZ and -7% for Australia. They are forecasting a rebound of +8.1% and +3.8% in q3 and q4 respectively for NZ, and +1.8% and +2.2% for Australia.
I expect politicised pundits to emphasise the June quarter negative and compare to Aus, whilst ignoring the forecast rebounds. The NZ and Aus differences reflect the different C19 strategies as well as the fact that Aus is less dependent on tourism. By contrast most economists seem surprised by the comparative resilience of the NZ economy.
The June quarter is largely history now but there may be some useful forward looking info in the Stats. The other key economic release today is the Pre-election Forecast Update PREFU. This will be an update on the May budget forecast and will provide a full picture of how Treasury sees the financial future.
I will provide some further commentary once iv reviewed it.
September 8
Reflections on Economic memes; not quite what they seem:
1. Job losses?
Latest IRD weekly payroll filings show that at 2 August 2,206k people were employed about the same as just before Lockdown 1 in March at 2,207k, based on the most accurate 25 day after filings data. More recent but less accurate 6 and 13 day figures until 23 August, including some of Lockdown 2, show employment numbers continuing to climb. Whilst there have undoubtedly been job losses, just as many new jobs have been created.
2. Population growth?
NZ Stats reports net migration to New Zealand for the year to 30 June 2020 was 79,400, the highest annual total on record. The majority of these at 45,500 are Returning New Zealand citizens. In addition since 30 June of course returnees have been arriving at the rate of several thousand every 14 day quarantine period. Including natural incremental growth total population increased by 105,500 over the year. At over 2% population growth this is huge, and over time will drive GDP growth.
We could be forgiven for believing that all our international tourists disappeared because of C19. Not quite. Stats NZ reported 100,000 remained in August compared with 250,000 in March.
3. Unemployment?
MSD reports for the week ending 28 August 222k people were on Jobseeker or C19 income support, up 77k on the pre Lockdown 1 level, and that this was 6.6% of the working population. How does this increase equate with 1. above that there has been no reduction in numbers employed? Well 2. above tells part of the story – a lot more people.
Some returnees will have found jobs and some people will have lost their jobs, but in total numbers employed are about the same. So the economy has done well with the aid of wage subsidy to maintain the level of employment, but has not yet been able to fully embrace the extent of the increased workforce.
This represents a big potential for economic growth in the future.
4. Jobs crisis?
Complementing the job loss meme is that it’s all going to get very much worse when wage subsidies come off. This may be overstated as more than 82% of the total number of jobs supported have already come off subsidy, with no observable decline in total numbers employed. Apart from international tourism and education, much of the economy is doing very well.
For example NZ’s terms of trade and export prices are at an all time record high with import prices flat. Cumulative merchandise exports since February are ahead of the equivalent period last year despite the global C19/ economic crisis.
5. House price crash?
Another economic meme has been that all the job losses (?) will cause a crash in house prices with a common reference being about 12%. Well that’s not happened yet, with house prices continuing to increase across most of the country with the exception of a significant decline in Queenstown.
An increase of 105,500 population combined with very low interest rates may give rise to continued upward pressure on house prices as well as on infrastructure.
6. Business failures?
There have been lots of anecdotal reports in the media about Covid19 driven business failure, but the overall statistical reality is somewhat different. There are about 550,000 businesses in NZ, and on average about 10% of these cease to trade every year, with a slightly higher number of new ones being established, as a normal feature of business demographics.
Any reports on business failure should be read in the context of c.4,500 a month going out of business on average anyway. The numbers of company insolvencies in the June 2020 quarter is actually >20% down on the same period last year.
Will businesses have used the wage and other support to rethink their business models for a post COVID world, or will the subsidies delay the inevitable? We don’t know yet, but I’m encouraged by businesses I work with who have emphasised the former.
August 16
Here’s a summary of significant economic data this week that predates
the Covid 19 resurgence. It’s still worth reviewing as it gives a platform from which to assess the resurgence economic response and recovery.
1. The big economic news of the last couple of weeks was the drop in unemployment to 4% in the June quarter, which left most economists scrambling to explain why their forecasts were wrong. Westpac Bank in their weekly updates came closest. They had been following the positive trend in the Stats NZ weekly payroll filings data on filled jobs, which I’ve reported on over the last couple of months.
2. The drop in unemployment was not quite as rosy as the 4% average figure would suggest because:
- during Lockdown in April people out of work were not counted as looking for work, as they couldn’t; and
- about 37,000 people chose to exit the workforce during/ following the Lockdown.
The other main outtake from the Stats NZ June quarterly report was an increase of 1.6% in labour underutilisation, which indicates lower hours or rate for those that remained in jobs.
3. Nonetheless the much better than expected employment rate prompted Westpac to proclaim
“the New Zealand economy bounced back from lockdown in far better shape than was anticipated”.
Westpac update, 10 August
Westpac suggested this is likely to be reflected in the Pre-election Economic and Fiscal Update (PREFU) from Treasury currently scheduled for 20 August, in which Westpac economists anticipated forecasts would markedly improve on earlier estimates.
4. Their optimism is also reflected in Treasury’s 14 August composite New Zealand Economic Activity index which is up 2% on July 2019 and back to pre Lockdown 1 levels.
5. MSD reports for w/e 7 August that 406,000 jobs were supported by wage subsidies down from about 1.5 million at peak. So the large majority of Covid wage subsidy has ceased, and according to the Stats NZ June quarterly employment report employment did not markedly deteriorate. So what happened in the following July/ August? The Stats NZ weekly employment data based on IRD payroll filings 6 and 13 day data fluctuate through the period, but the overall trend is upwards (see https://www.stats.govt.nz/…/Employment-indicators-paid-jobs…).
6. On 5 August I reported on the trend in the MBIE on line job advertisements index to June 2020. Job advertisements are a measure of prospective employment. The index fell to 0.39 at the low point of Lockdown 1. The July index was published last Friday at 116.5 continuing the upward trend from the prior month by +14. In comparison, it took nearly six years post the GFC to rise to this level.
Neither available July employment data or on line jobs availability indicate dramatic employment falloff so far in the September quarter. Although 406,000 jobs remain supported by job subsidy, this is dwarfed by the million plus jobs which have already came off subsidy without significant job losses.
But to what extent will this better than expected position be affected by level 3 Lockdown in Auckland? Perhaps not much if the current success in containing the cluster moves to reestablishing elimination in short order, which seems possible. The further extension of the wage subsidy will compensate to some extent.
The downside risk is loss of confidence, but on the other hand rapid success in test, sequence, track, trace, eliminate could enhance confidence. Genome sequencing has found no link to cases in quarantine, so at the time of this note the source remains a mystery.
This coming week will be critical.
August 1
Ten themes below on current situation, but first of all….
- References and data:
Jarrod Kerr, Chief Economist of Kiwibank issued on 16 July a webinar providing a valuable overview. The ANZ July 8 quarterly economic summary is also useful for painting various economic scenarios. Mostly I have drawn on recent Treasury, NZ Stats and MSD datafor this analysis.
- This analysis is in the aggregate.
A feature of the COVID19 induced downturn is that the impact has been radically different on different sectors of the economy and population.
Merchandise exports have remained more or less on track. Some high tech businesses have experienced terrific growth (eg Fisher and Paykel Healthcare). Many hospitality businesses are continuing to do well, but the trend towards working from home has impacted some inner city venues.
Retail has bounced back, but The Lockdown introduced many people to the joys of online retail and accelerated the shift of businesses in this direction, to the point where it is probably now an ongoing structural change.
On the downside, businesses and their employees that cater significantly for international tourists and international students are obviously struggling.

1. Vaccine
Cabinet papers released on 31 July show that the NZ government is planning on a best case scenario of a COVID19 vaccine rolled out by end 2021.
This may have improved a bit given the speed with which potential vaccines have progressed through human trials in the UK, Australia, China and the USA. Dr Helen Petousis-Harris is a vaccinologist, Associate Professor at Auckland University and chair of the World Health Organisation advisory group on vaccine safety. She has advised that it’s 95% probable a vaccine will be available by end 2020, but it will take much of next year before it gets to a GP near you.
The risk is we get trampled in the stampede for the vaccine by wealthier countries. MBIE, Health and MFAT have implemented a five point strategy to seize the opportunity. Clearly a viable vaccine distributed at scale will be a total health and economic game changer.

2. Employment
Stats NZ advises that there was an increase of 17,897 filled jobs in June (latest month available) compared with May, and earnings were $11.2 billion, compared with $10.3 billion for June 2019.
Paid jobs in the last week of June were 2,188k down from 2,208k in the last week, but up from 2,101k for the equivalent period in 2019. This is based on IRD payroll filings 27 days after the week’s end (regarded as 95% accurate).
The risk is that as wage subsidies come off, there may be more job losses. There is an early indication from more recent but less accurate weekly IRD Payroll data that numbers employed may be tracking slightly down in July, but it’s not a flood and it’s too early to say if this is data fluctuation or a trend.
The opportunity is that the full extent of the massive fiscal stimulus being applied to the economy has not yet kicked in.

3. Population
The data for the estimated working age population at June 2020 (EWAP) from NZ Stats was released on 29 July.
This is the basis for estimated unemployment rates and has implications for various economic policy considerations such as housing supply and demand, GDP growth and infrastructure needs. The EWAP has increased from 3,902k at June 2019 to 3,938k at Dec, 3,964k March 2020 and 3,983k at June 2020; a year over year increase of c.80,000.
This is the highest annual increase since 2016 and the second highest since records began. Returning Kiwis contributed the majority of the increase in the last six months. This increase helps explain why employment levels are significantly up on a year ago, but so is the number of those unemployed.
The risks are that demand pressure on housing and infrastructure will increase commensurately with population, and that there will be an unprecedented need for job creation at the same time as there is a global economic slowdown.
The opportunity is that such a large increase in the working age population with overseas acquired skills and connections will enhance GDP growth and innovation. Some people will be bringing work with them.

4.1 Unemployment
Unemployment in Q1 to end March was 4.2% and the quarter result announced on 5 August was 4.0%. This improvement caught some economists by surprise, but is consistent with the increased number of jobs reported in IRD payroll filings data noted above. The unemployment figure is less meaningful this quarter because of the technical complexities of estimating the working population in the Covid environment, and because of labour underutilisation.
MSD paid unemployment benefits data is perhaps more immediate and useful in estimating unemployment levels. They reported 192k people on Jobsaver benefits in the week of 24 July plus another 20k on COVID19 Income relief payment = c. 212k. That’s up from 136k in June last year = + c.75k. MSD reports that the percentage of people on Jobseeker benefit in the week of 24 July was 6.4%. This is less than peak unemployment anticipated by Treasury as 9.8% in the September quarter.
Most economists are now anticipating less unemployment than they had previously forecast – for example, Jarrod Kerr sees unemployment maxing out at up to 9% before a quicker return towards full employment next year than they had previously anticipated, and they are confident that the downside risk of 13% or more that they forecast in May now won’t happen.
In summary, the economy has sustained employment in aggregate but to date has not been able to absorb the large increase in population.
Risks are that unemployment in some specific industries such as air travel, international tourism and international students will stay high for some while. The opportunities are that there will also be labour shortages in some other industries particularly those reliant on imported labour, so retraining will be needed; there will be a significant infrastructure boom; and many businesses have reinvented themselves as a consequence of the COVID19 experience and will be rehiring.
4.2 Job Vacancies
MBIE from May 2007 has produced a regular monthly index of data on job vacancies derived from leading internet based job advertisers (eg TradeMe).
This provides a prospective view of employment. The numbers of vacancies identified through internet job ads may not be a completely accurate reflection of all vacancies, but the index shows trends up or down. The index base is 100 at about 45,000 jobs.
The index stayed reasonably constant through to the GFC when it dropped dramatically into the 50s in 2009, 60s and low 70s in 2010, 70s / 80s in 2011, 80s / 90s in 2012, before creeping back to 90s / low 100s in 2013. Another indication of just how long it took to get over the GFC.
The index trended steadily upwards from 2014 to 2017 and from 2018 to February 2020 increased further to an average of c.143 through to February 2020. This cratered to 39 in April, lower than at any time in the GFC, before jumping back to 71.5 in May, and 102.6 in June.
This rapid improvement in job vacancies if continued in July suggests job opportunities emerging to a greater extent than suggested by the prevailing wisdom. One risk is an uncontained second wave outbreak (eg Victoria). Assuming that doesn’t happen, there may also be a risk of skilled labour shortages as the economy regenerates and as border controls limit access to the global labour market.

5. Activity
In their 31 July update Treasury affirms that retail spending appears resilient and recent Paymark data shows spending to be above 2019 levels for the equivalent period and higher than pre Lockdown. Other high frequency economic indicators such as electricity usage and light and heavy traffic are also back to about pre Lockdown norms, although there appears to be more regional variation than previously. This will also be helped by Kiwis returning home.
Jarrod Kerr is surprised how well spending has held since Lockdown was relaxed, and sees this as an ongoing positive trend. He explains that this is especially notable in DIY, restaurants, petroleum, sporting events, on line retail, pets (“buying something furry that runs around to keep you entertained at home!”), and domestic recreational travel and accomodation. He points to structural shifts towards on line retail, and away from cinemas.
The major risk to retail economic activity is the potential for job losses as employment subsidies come to an end.
Opportunities arise from population growth technological innovation and reimagined business and operating models.

6. GDP
The economy is now operating at about 95%.
Some industries have been devastatingly impacted, but we shouldn’t mistake that for the whole economy.
Population growth will have an impact on % GDP growth, as a rule of thumb roughly equivalent to the % population growth. Growth of 80,000 in the working age population is approximately equivalent to 2% so this will contribute to absolute GDP growth, but not of course to GDP per capita.
GDP is forecast to drop dramatically in the June quarter because of the Lockdown, before bouncing back in Q3.
Jarrod Kerr explains that the downside risks, “have now receded since May and that this is a big change in mindset that all economists are going through”. He anticipates -7.7% GDP in 2020, increasing by c.5.5% in 2021 and back to Pre-COVID19 levels by 2022. Kerr notes that NZ’s situation has got better than they expected over the last couple of months and is one of the best you will see globally, but notes that the rest of the world has got worse.
The major risk to a return to growth is that the situation in the rest of the world continues to get worse. A good example of this is the crisis in Australia which has forestalled the growth that a Trans Tasman bubble could have created. Introduction of austerity measures would also be a major risk.
Opportunities are population growth, infrastructure spend, fiscal stimulus and innovative business models.

7. Debt to GDP
It has been portrayed in some media as obvious that we will have to pay all this debt back. But in my May 16th post I suggested that actually we don’t, at least not any time soon. It’s good to see this view now being affirmed by some economists.
Jarrod Kerr explains that “none of the debt concerns us. Countries around the world would love to start where we will finish (after fiscal stimulus) at around 50% of debt to GDP. 20% is too low. 50% is realistic to get infrastructure needs done.
Our credit rating is Aaa by Moody, at the same level as USA and better than the UK. Better than almost everyone. We are at a low point with interest rates and likely to stay that way for a long time.”
NZ’s global reputation has risen significantly as a well managed advanced economy in recent months, and our debt worthiness will be amongst the world’s best. With anticipated minuscule rates of interest it would be a mistake that could damage economic recovery and have significant negative social consequences if NZ attempted to run economic surpluses to pay down debt to 30% or less inside a decade. And it would be pointless.
The risk here is that political pressure pushes NZ towards austerity when fiscal stimulus and investment is needed for growth and employment.
The opportunity is that interest rates are so low that the strength of the government balance sheet will enable thoughtful investment in assets that yield sustainable growth.

8. Housing
The conventional wisdom amongst economists has been that house prices will drop because of COVID19. But the housing market has surprised them. House sales bounced back after Lockdown. New dwelling consents rose 0.5% in June to be up 20.4% compared to June 2019, although this may still reflect some pent up activity from Lockdown.
Jarrod Kerr still expects a dip in house prices of up to about 8% later this year, but that it will be short lived. Upside price pressures include: interest rates are low and will stay that way for the foreseeable future; loan to value ratio restrictions have been removed until May 2021 by the Reserve Bank; mortgage payment deferrals have been instituted; there is a chronic shortage of housing and the population growth referred to above will only exacerbate this.
Treasury notes that requests for mortgage deferrals peaked in the week of 10 April to 28,000 and that deferrals have now dropped right down to 400 in the week to 17 July.
Risks to residential property values come from the reduced demand for international tourist and student accomodation, and short term holiday rental properties coming onto the market either as longer term lower price rentals or as sales.
But the opportunity arising is greater accessibility to accomodation for Kiwis. This phenomenon is likely to be short lived, and it’s impact will vary significantly with the type and location of the property.
9. Exports
Merchandise exports improved in June by 2.2% compared to the same month last year. NZ achieved the smallest annual trade deficit in nearly six years. The trade balance for the June quarter was a surplus of $1.4 billion, the first quarterly surplus since the March 2014 quarter; exports held up whilst imports declined.
Risks relate to disrupted global value chains.
Opportunities relate to import substitution (including domestic tourism), and exploiting the New Zealand brand reputation.

10. NZ Stock Exchange
The NZX50 closed on 31 July at 11,727.63, up on a week ago, a month ago, 3 months, six months and a year ago.
It’s informative to reflect on why the NZX is doing well in the face of this global pandemic. There are four main reasons.
- Interest rates are extremely low and likely to remain that way for the foreseeable future; this tends to push investors away from deposits towards shares which may carry a higher return.
- Stock markets reflect the discounted value of future streams of cash flow, and tend to look beyond short term considerations; this too will pass.
- Central Banks are flooding capital markets with quantitative easing, and the cash needs to go somewhere; often this can lead to asset inflation.
- The underlying business of most listed companies unless exposed to tourism or air travel continues to perform comparatively well.
The industry related risks – eg air travel – have crystallised and are priced in. With interest rates this low, companies have taken the opportunity to raise capital and have done well.
Risks include fragile global value chains, disruption of outdated business models, exposure to customers in COVID19 impacted industries and further geopolitical shocks.
Opportunities arise from New Zealand’s sky rocketing brand reputation, technological innovation and sustained global demand for safe food.
References
Kiwibank – https://www.kiwibank.co.nz/contact-us/support-hub/coronavirus-updates/economist-updates/
Treasury 31 July – https://treasury.govt.nz/system/files/2020-07/weu-31jul20.pdf
ANZ – https://www.anz.co.nz/content/dam/anzconz/documents/economics-and-market-research/2020/ANZ-QEO-20200708.pdf
MSD – https://www.msd.govt.nz/documents/about-msd-and-our-work/publications-resources/statistics/benefit/2020/income-support-and-wage-subsidy-weekly-update/income-support-and-wage-subsidy-update-24-july-2020.pdf
Stats NZ – https://www.stats.govt.nz
July 18
Here is a summary of this week’s encouraging economic data from MSD, Stats NZ and Treasury updates, which they publish at the end of each week.
In its 17 July review Treasury reports “Economic activity now only slightly below 2019 levels”, and the economy “showed a continuing recovery in June”.
“New Zealand’s near normal economic activity contrasts with what’s being seen overseas.”
17 July Treasury report
Treasury is now publishing a composite New Zealand Activity index that aggregates key high frequency data including consumer card spending, heavy traffic, light traffic, job advertisements, electricity demand, business activity outlook, and Jobseeker/ Covid19 payments. This aggregate index was down just 0.9% on last year, and most of the indicators were up for June compared with the prior year and compared with April and May 2020. However, the index was dragged down by the increase in the number of people on Jobseeker benefits.
In further positive data the BNZ/ Business NZ performance of manufacturing index rose to 56.3, the highest level since 2018 – above 50 indicates growth. Similarly Stats NZ reports the total cumulative value of goods exports for the five months to 7 July to be at about the same level as 2019, despite Lockdown.
“Key indicators have risen by more than expected and it looks like the downturn will be at the more moderate end of expectations”.
Westpac Bank 13 July weekly commentary
They note the strength in household spending including in bars and restaurants and speculate this may be assisted by the absence of overseas holidays. Westpac also notes that while the number of people on Jobseeker/ Covid support has increased by more than 60,000 since March, “the extent of job losses has actually been more modest than we expected. We had been braced for the loss of more than 100,000 jobs through the middle part of this year, and both the RBNZ and Treasury expected even larger losses”.
But the big story missing in these several analyses and from media commentary is that there has not actually been a significant aggregate reduction in paid jobs, as explained in previous posts. The latest IRD payroll data shows that for the week of 14 June at 27 days after filing (rated as about 98% accurate but more timely compared to formal quarterly NZ Stats employment data) there were 2202280 paid jobs, just slightly less than 2207880 on 29 March immediately prior to Lockdown, and up from 2197170 the week before. Significantly this is 110,000 paid jobs up on the same week last year – 2093440. The economy continues to create jobs despite Covid.
The primary explanation for the apparent discrepancy between no significant reduction in total numbers of paid jobs compared to pre Lockdown, and >60,000 increase in people on Jobseeker/ Covid support, is because of more people in particular Kiwis returning home.
NZ Stats has reported 42800 citizens returning home in the year to end March with more than half since December. 35700 citizens departed during the year giving a net gain of 7200, the highest on record and compared with a usual annual net loss.
We also know that about 30,000 people, mostly Kiwis, have come through managed isolation since Lockdown, with more in the pipeline.
In addition, a net 71500 people migrated to NZ in the year to March 2020. NZ Stats explains that it’s hard to get accurate data on this because of Covid so this is subject to adjustment. But it does help explain the increase from a year ago in total paid jobs.
Once these additional people are assimilated into the workforce there is the potential for a further boost to economic performance. The Otago Daily Times in a 6 July article explained “How returning Kiwis could boost the economy”, as did the NZ Herald “The Brain again: How returning Kiwis will boost the economy.”
Whilst there is no doubt that the global health and economic crisis will continue to cause severe headwinds for New Zealand particularly in aviation, education and tourism, the data shows that the economy and employment have proved remarkably robust to date post Lockdown.
We cant easily predict what will happen when wage subsidies conclude, so there may be overall job losses to come, but they’v not happened yet. Whilst we are mercifully hearing no more punditry now about ‘why can’t our health approach be more like Australia, Sweden, Singapore…’, there are still predictions of present and future economic disaster which are not supported by available evidence. I encourage skepticism of such claims. There are grounds for believing that New Zealand’s economic response is shaping up to be as world leading as the health response – they are indeed interdependent.
July 11
Here is an update on New Zealand’s economic performance based on the most recent evidence from Treasury, MSD, and NZ Stats. A lot of media commentary is based on anecdote or ‘opinion journalism’, so this post focuses on data – see Stats.govt.nz; MSD.govt.nz; Treasury.govt.nz for the details.
MSD data shows that the number of people on Jobseeker benefits in June has increased by a bit over 50,000 since February pre Lockdown, and relative to last year. This equates to about 6.4% of the working population up from 4.9% in January.
However, the total number of paid jobs as reported by NZ Stats based on IRD payroll filings was 2197170 for the week of 7 June, up from 2086090 the year before, and compared with 2207890 end March prior to Lockdown. This is the latest available data from the IRD based on 27 days after the end of the base week, regarded as c.98% accurate relative to NZ Stats official data (which only come out quarterly; for June qtr on 8 August). IRD data is more granular, so trends can be observed.
NZ Stats also posts IRD filings data 13 and 6 days after the base week. These are regarded as c.93% and c.75% accurate relative to official Stats data. These data show a steady increase in the number of jobs since we moved to Level 1 on 8 June, eg up about 6,000 based on the 13 day data.
Those pundits claiming large numbers of lost jobs have not properly interrogated the available data. In all probability they have simply looked at the increase in jobseeker benefits and attributed these to lost jobs. Whereas in fact the main reason is the >60,000 returning NewZealanders that the economy is having to assimilate.
The number of jobs at end Q2 will be similar to pre Lockdown, not down. This large scale net immigration over a short period has the potential to contribute a significant economic boost.
Meanwhile Treasury this week reports that “high-frequency indicators of economic activity continued to recover or remained steady at around normal levels”. In particular for the first time since Lockdown, this week card spending increased back above the level for the same period last year.
The average employment for the June quarter will of course be down because of the April lockdown. But employment has increased back up to pre Lockdown levels since Level 1.
Q1 showed negative GDP growth of -1.6%, and Q2 including most of the Lockdown will also be negative, so NZ was technically in recession in Q2. But this will be short lived as Q3 will show significant bounce back growth, thereby exiting the recession.
Most of the world is in far worse shape than NZ in terms of its Covid-19 health response, and related economic consequences, so the global economic headwinds will continue to be challenging. But we are set to come through this crisis better than most.
June 26
The level of angst about the delay in implementing testing pre-exit from Covid 19 isolation seems disproportionate. The isolation system that got us to elimination of chains of transmission from the community in the first place, has remained in place throughout.
As Level 1 was introduced routine testing was introduced as an additional safeguard. But implementation was delayed by a week until 16 June, for reasons Dr Bloomfield has declined to state, presumably so as not to identify those responsible.
As Dr Bloomfield and knowledgeable experts in the field have explained repeatedly (eg see Siouxsie Wiles detailed analysis in the Spinoff of 25 June – “Why I’m confident there is no community transmission in NZ”), 14 days isolation and health check for symptoms on exit are the primary safeguards. With these in place the risk is very low. Tests can yield up to 20% false negatives (mostly because of clinical difficulties of sampling in the field) so can’t be completely relied on absent the isolation period and no symptoms.
But somehow the delay in introduction of additional precautionary pre-exit testing became a catastrophe in the media despite no evidence of community transmission.
It’s bewildering really, and I’m not sure if it’s fear-mongering or ignorance of the science. Either way it’s not helpful. Yes we must all remain vigilant, but let’s do our bit to share evidence to counter unwarranted angst.
June 26
The total number of people employed and jobs in NZ is increasing not decreasing, but a scan of mainstream media this week would lead you to conclude the opposite.
This is an update to my post from Monday based on this week’s publicly available stats from Stats NZ using IRD payroll filings. The 4 week rolling average is seen as 98% accurate when compared to Stats NZ own data.
Total numbers employed were 2208160 on 24 May, the latest date available for a four week average. This is 100,000 up on the equivalent date last year, and 20,000 up from the four week data I cited on Monday.
More recent weekly data at 14 June continues to show a steady increase, up 2% from the week before.
The mistake commentators are making is to base their analysis on MSD data of those on Jobseeker benefits. These are up by about 50% on pre Covid levels, but this is very likely attributable to the c. 60,000 overseas Kiwis who returned home to our safe oasis.
Yes jobs are being lost but more are being created, noting there will be disproportionate impact on some industries and people.
There might be job losses once the Covid employment subsidies come off, but they have not happened yet, and MSD survey data suggests only c. 5% of employers are contemplating this.
I conclude that media could do more to highlight innovative job creation and contribute to a sense of optimism, rather than doomsday scenarios unjustified by the data.
June 22
NZ will be out of economic recession in a week’s time.
Economic Recession is defined as two consecutive periods of negative GDP growth. March was -1.6%.
Treasury forecast -20% for June in the May budget papers, but have reduced this in their latest weekly update because of the early move to Level 1, but did not provide a specific forecast.
Westpac Bank provides weekly detailed forecasts and shows -13.8% GDP for the June quarter, meaning we are in recession in the June quarter as the second in a row.
They forecast +14% for September based on Level 1 and improved economic activity data, and Treasury also forecasts an upturn, meaning we won’t be in recession in the September quarter.
The total number of employed people dropped by about 100,000 during Level 4 but recovered by May 17 to c. 2.19m about what it was in February and March and higher than January, according to StatsNZ based on data derived from IRD payroll filings. This has a 98% level of accuracy when compared to StatsNZ quarterly employment reports (June quarter not available until August), but a greater level of granularity and immediacy.
The number of people on jobseeker benefits is also provided as an indicator of levels of unemployment. Numbers increased by about 45k to 190k by end April and have remained steady at about that level up to the latest available date of 12 June.
So the economy has sustained pre lockdown levels of total jobs.
But unemployment is up by 25%.
How does that work?
My hypothesis is returning Kiwis of which wev had c.60,000 with many more arriving daily. Absorbing this number of people in short order into the economy could be challenging. On the other hand returning talented people will add capacity which can be a boost to the economy for the recovery.
June 21
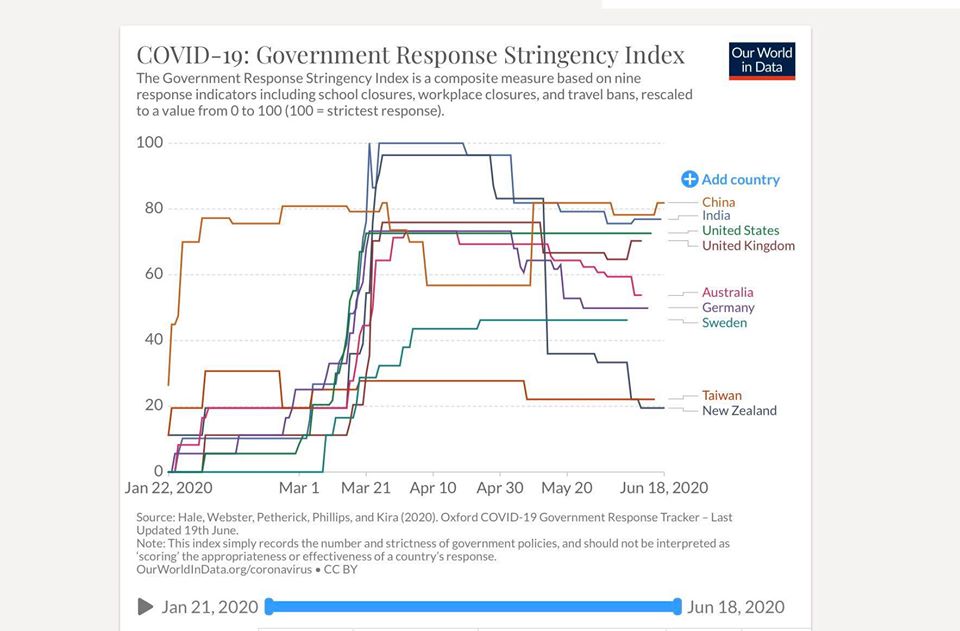
A picture tells a thousand numbers. This is published regularly by Oxford University. Shows the level of social and economic restrictions of different COVID-19 response strategies. Iv selected countries with which NZ is often compared or are significant trading partners. You can select any set of countries interactively.
June 20
Our little tourist town of Russell seems to have been busy since level 2, given its winter. Wev been on our boat in the Med the last four winters, so we checked with local restaurants if this was normal business. And the consensus seems to be quite a bit busier than last winter. To emphasise the point as we were sipping our mulled wine a party came in and booked a table for 15!
We checked out the Tourism New Zealand website which has some new detailed stats on the significant increase in domestic travel since level 2. It shows a dramatic increase over the Queens birthday period, broken down by region, and confirmed for Northland what we observed.
The stats also confirmed there are lots of international visitors in NZ still. Some of them we know are in Russell, happy to be enjoying Covid extensions to their visas and to be safe.
DOC has reported a 36% rise on last year in Great Walks accomodation bookings, despite our closed borders. So there seem to be some promising signs for tourism and hospitality.
How is it in your regions?
June 14
The OECD issued ‘Economic Outlook: Global economy on a tightrope’ on 10 June, as a comprehensive independent global analysis and forecast of the economic consequences of COVID-19. Detailed country analyses are included.
Two issues worthy of note emerge from a reading of the full report:
1. The OECD report models both single hit and double hit scenarios – that is a ‘second wave’ of C-19 infection. There is increasing concern about this potential in Europe and the USA, arising from too early release from health restrictions. The OECD modeled the economic consequences of potential second hits for each country, and they reveal dramatic deterioration. It shows just how significant elimination is, both as an economic strategy, and catastrophic risk mitigation.
2. Further into the report, figure 1.9 shows forecast economic recovery across OECD countries based on known policies in place and success in combatting COVID-19, by comparing actual Q4 GDP 2019 levels to forecast Q4 2021 levels. Encouragingly it reveals that New Zealand recovers almost back to December 2019 pre C-19 GDP levels by Q4 2021 at -0.088%, more quickly than all but two of the 37 OECD countries. Australia often cited as a comparison to NZ is forecast to do less well at -0.920%.
This analysis tends to confirm the view that a strong health response is indeed also the best economic response.
June 7
Following our exceptional success in eliminating chains of transmission of C19, there is now growing evidence that the negative macro economic impact will be less severe than feared. Government fiscal support and investment, plus business resilience and innovation are combating the economic fallout from C19.
Here are 8 reasons to be optimistic.
(Read on if you are worried by the fear-mongering about economic doom, if not you can stop here!):
- We are very likely to be moving to Level 1 far sooner than was anticipated in Treasury forecasts and this means most economic activity will be restored much earlier (main exceptions being international tourism and students until safe bubble/ quarantine arrangements are in effect).
- Treasury reported positive economic activity indicators in its 5 June weekly report – electronic card spending in level 2 has been about equal to the same period last year, electricity use is now above pre COVID19 levels, heavy traffic is close to pre C19 levels, and the April (Level 4) merchandise trade surplus was the largest on record, because exports remained buoyant whilst imports declined.
- Treasury’s 5 June report also noted that the increase in numbers of unemployed people on Jobseeker benefits to just 6.3% was lower than expected, and the recent rate of increase was low.
- Westpac Bank in their 2 June weekly economic forecast also noted that recent economic activity data showed that the economic situation may not be as severe as expected, and expressed surprise at the better than expected employment figures. They revised downwards their 2020 unemployment forecast of 9.5% to 7.5% (better than their comparative figure of 7.6% for Australia).
- More than 80,000 Kiwis returned home which will provide an economic activity boost.
- The NZX50 has continued to enjoy positive gains, up another 450 points since my post on 16 May, and the NZ$ has strengthened, signifying investor confidence.
- It seems likely that there will be a Trans Tasman bubble within two or three months (Australia provides nearly half of our normal international tourists). Domestic tourism is about 60% of total, and domestic spend will increase as its difficult/ less desirable to travel overseas – historically Kiwis have spent c. $7billion a year on international travel.
- NZ has one of the lowest debt to GDP ratios in the OECD even after the increased borrowing, which will sustain the recently affirmed S&P AA+ Positive sovereign credit rating and low cost of government borrowing.
None of this is to deny the undoubted difficulty and stress that many people and businesses, especially in the tourism, hospitality and events industries, are experiencing, but overall the economy remains strong. Prognostications of economic doom are political posturing, and can be regarded with skepticism.
June 5
It’s up to the USA people of course who they elect as their president, but the leadership choices they make inevitably reverberate around the world. So I’ve been interested to follow the regular USA election polls, as well as political betting odds, better to understand the unfolding momentum towards the November election.
Through much of his presidency the current president’s unpopularity has been remarkably stable in the mid 40s % approval rating. But that’s been changing in the last few weeks. The net disapproval gap (disapprove – approve) now stands at 11.3% on fivethirtyeight.com which continuously merges and updates all polls. In a Biden / Current President contest Real Clear Politics shows Biden ahead by 7% overall as well as ahead in 5 key battleground states. But until a few days ago betting odds consistently showed the current president as the odds on favourite.
That changed very recently to Evens and now to Biden as Odds-on firming. Political betting can provide a different perspective in that it asks who will win, not who will you vote for, and punters commit an investment. It’s still a long way to November, but re-election would no longer appear to be a sure thing.
May 16
Investors have confidence in the NZ economy. The NZX 50 is alone amongst the Dow, FTSE, DAX, Hang Seng, Nikkei, and ASX 200 in being UP on this time a week ago, a month ago and a year ago.
May 16
Two different surveys out today give cause for optimism for domestic tourism in the Bay of Islands.
The Spinoff published results of a statistically valid survey that showed 42% of respondents plan to travel outside their region in the next quarter. Northland is a popular destination.
Horizon Research as reported on RNZ.co.nz did a different statistical survey which showed that more than a million New Zealanders plan to travel domestically in the next 7-12 months with 378,000 definitely coming to the Bay of Islands. Queenstown, the BofI and Nelson are the clear favourites.
Spending data I found suggests this could be up on last year.
Our lovely little town of Russell depends significantly on tourism to sustain our wonderful restaurants and facilities. But I hope some of the low value tourism activity that overruns facilities (eg at the extreme end three cruise ships at once in the bay) will diminish post C19.
May 16
The 2020 budget does what it says on the cover and prioritises saving jobs. Few would argue with that necessity. On the forecasts jobs are saved or created to the point where we will be back to pre Covid levels in a couple of years. That will be an amazing achievement. And Standard & Poor’s in giving us a AA positive rating on May 14 thinks Treasury’s budget forecasts are conservative. But it comes at a massive cost, with sovereign debt to GDP rising to >50%.
There has been a lot of bleating about how will we repay this, but I don’t believe we need to any time soon. Recent publications by the IMF have suggested that the capacity for sovereign debt in well run advanced economies is far higher than previously thought, especially in the light of very low interest rates which are likely to be around for a long time. By way of examples even before C19 Japan was at over 230%, USA over and France and Spain close to 100%, Canada 90%, UK 83% and set to climb, EU average 80%, even Germany is 62%. 50% appears modest in comparison.
May 5
The efficient market hypothesis suggests that stock exchange market prices reflect all relevant information including about future prospects. Although somewhat controversial from a technical analysis perspective the EMH remains a cornerstone of modern financial economics.
A number of studies have shown a correlation between a country’s economic performance over time and its stock market performance. So I decided to look at what the NZX might be saying about investors’ confidence in the future of the NZ economy. The NZX50 is up c.8% over the last month of lockdown, and up 6% on this time a year ago. By way of comparison the ASX200 (Australia) is up just 1.5% on a month ago and down c.17% on a year ago. Whilst there will certainly be short term economic pain ahead, the NZ stock market at least suggests that the economy will get through this well in the medium term.
Certainly brand New Zealand has grown significantly on the world stage through this crisis as a safe and well run country, which will in turn enhance our future economic prospects. It’s my hope that the insights achieved through the crisis about social connectedness, kindness, and a new wave of innovation, will also flourish.
See all posts